How to Insert Pie Charts in Google Docs
There are two methods to add a pie chart in Google Docs. You can create a new pie chart right from Google Docs or add an existing pie chart from Google Sheets.
Method 1: Create a New Pie Chart
Step 1: Click on Insert > Chart > select Pie from the menu.

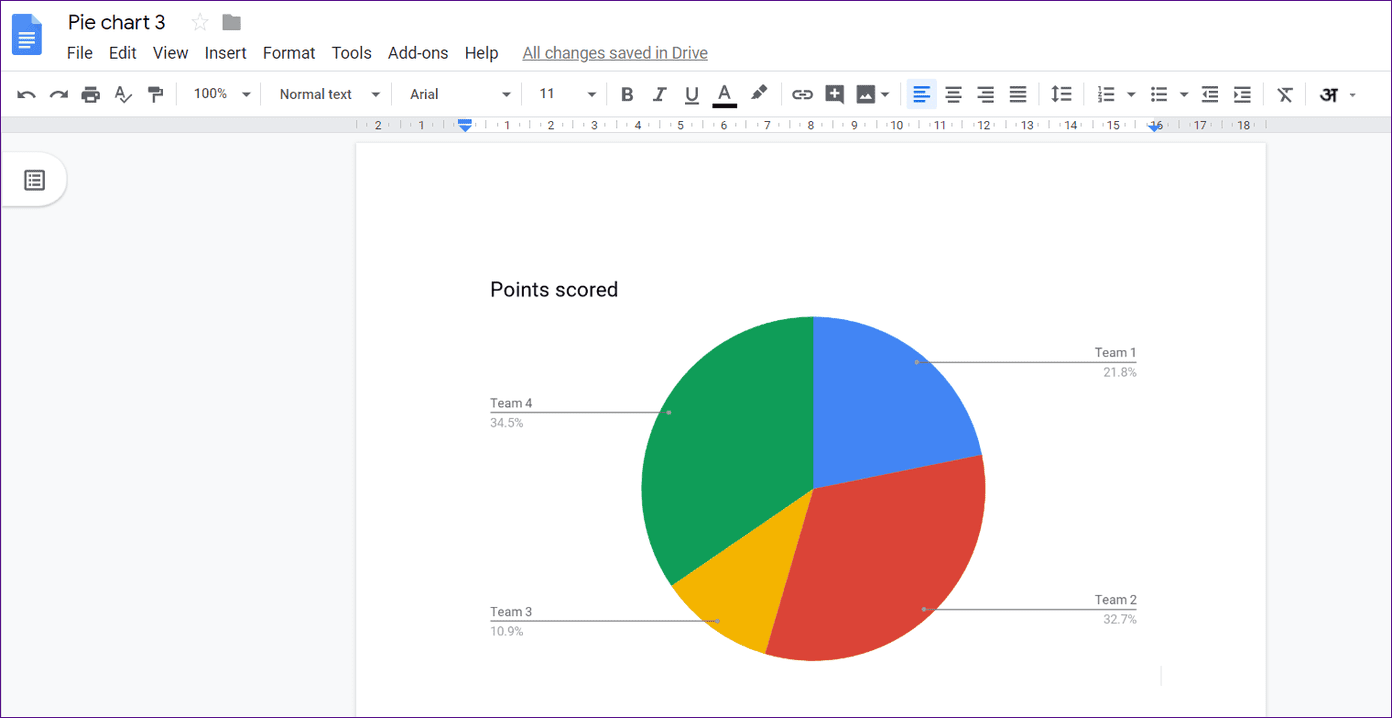
Step 2: A pie chart with sample data will be added in Docs. You will notice that you cannot change the values directly in Docs. For that, you must edit the pie chart in Google Sheets (more on that below).
Method 2: Add Existing Pie Chart From Google Sheets
Step 1: If you have a pie chart and its data in Sheets, you can easily add it to Docs. To do so, open the Docs document where you want to add it > go to Insert > Chart > From Sheets.

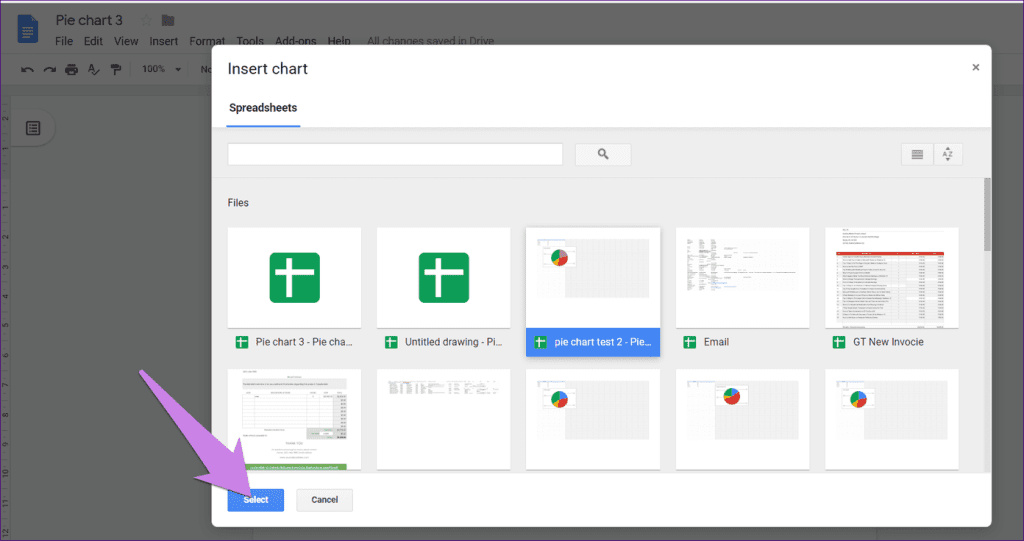
Step 2: The interface will show your spreadsheets. Click on the one with a pie chart that you want to add and hit Select.
How to Add Information to Pie Charts
Step 1: To change the data for a pie chart, click on the chart once. You will see the three dots/link icon at the top-right corner. Click on it and select Open Source.

Step 1: You will be taken to a spreadsheet.
- If you add a new pie chart to the document, you will see an empty spreadsheet where you can add information.
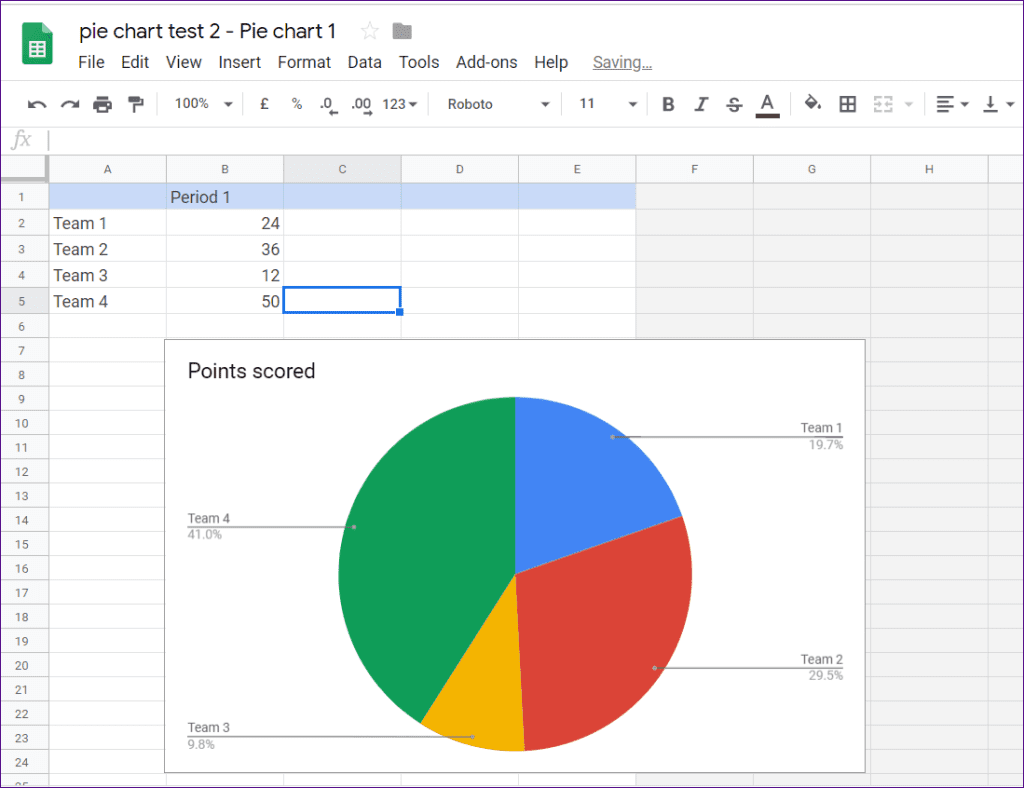
- If it is a pie chart from an existing Google Sheets document, you will see the list of values you can edit.
Scroll up, and you will find the rows and columns with its data. Change the section names and their values as per your need. The same will be reflected in the pie chart.
Update the Pie Chart in Google Docs
Any change you make in the spreadsheet of the pie chart will not reflect directly in Google Docs.
You have to update it. Click on the update button to reflect the changes in your pie chart.

Also Read: How to use voice typing on Google Docs
Tips to Customize Pie Chart on Google Docs
1. Change the Title of the Pie Chart
The default title of the pie chart is Points Scored.
Step 1: Open the source spreadsheet of the pie chart. Double-click on the same text in the spreadsheet.

Step 2: Type the new name for the title. You can also change the title font, size, and color from the options under Chart & axis titles in the right window. Click on Update in Google Docs.

2. Change the Color of Individual Pie Slices
A pie chart usually has slices of different colors. If you don’t like the default colors for pie slices, you can change them.
Step 1: Open the source of your pie chart, i.e., the linked Google Sheets as shown in the edit pie charts section.
Step 2: Double-click on the slice whose color you want to change.
Step 3: From the Chart editor options on the right, choose your preferred color from the Pie slice color under the Customize tab. Update the changes in Google Docs.

3. Add Background Color to the Pie Chart
Step 1: Open the pie chart in its spreadsheet. Double-click on it to show Chart editor options.
Step 2: Click on the Customize tab > open the Chart style section. Change the background color under the provided option > hit the Update button in Docs.

4. Create a 3D Pie Chart
In the source spreadsheet, open the Chart style section under Chart Editor. Then, check the box for 3D > hit the Update button in Docs.

5. Show Values Inside Slices
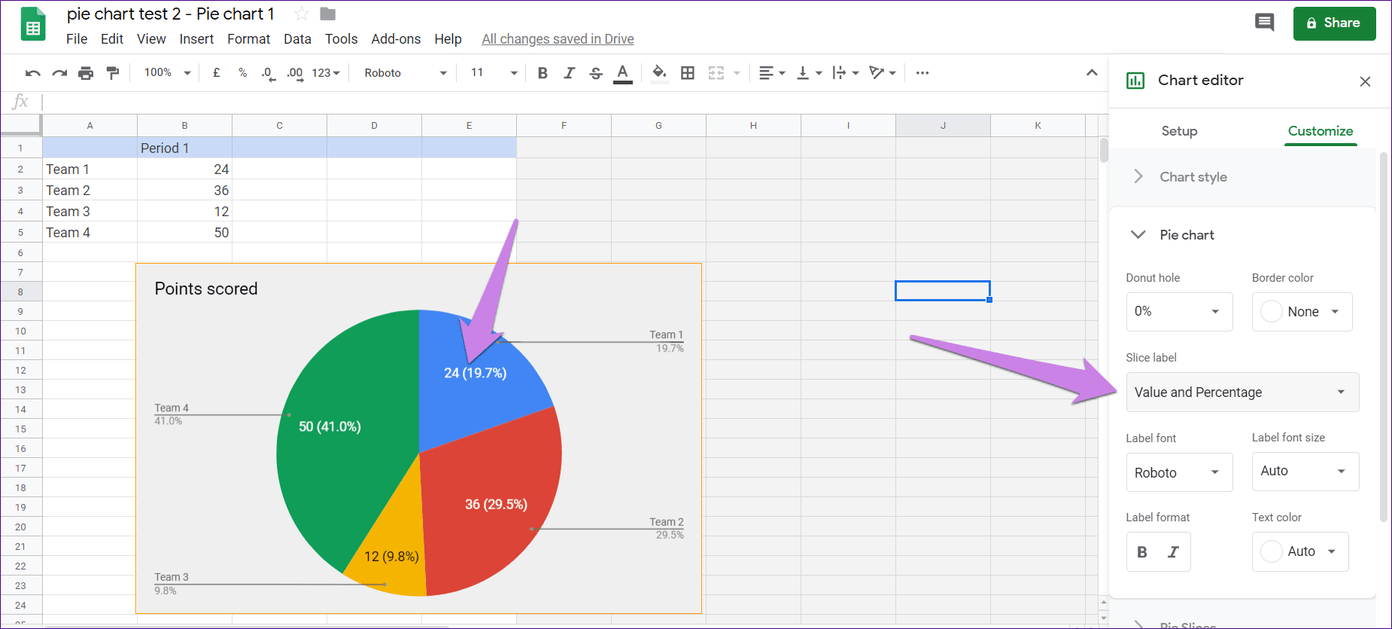
By default, the pie chart values will be available outside the chart.
Step 1: To show the values on the top of the pie chart, open the Chart editor window in the spreadsheet.
Step 2: Then, open the Pie chart section and click on the drop-down box under the Slice label. Select your choice. You can also change its text color. To reflect the changes, click on Update in Google Docs.
6. Change the Position of Labels
Step 1: To do so, open the Legends section under Chart Editor > Customize in the pie chart spreadsheet.
Step 2: Select the location under the Position drop-down box. If required, change the text color, size, and font. Then, update the Google Doc.

7. Download the Pie Chart as an Image
For that, open the pie chart in its spreadsheet. Then, click on the pie chart and hit the three-dot icon at the top-right corner. Select Download and choose the image type.

8. Change the Theme of the Pie Chart
Instead of changing the color for each slice, you can change the theme of your pie chart.
Step 1: Click on your pie chart in Google Docs > hit the Format option at the top > select Image > Image options.

Step 2: From the Image Options window on the right, select the color from the drop-down box under Re-color.

9. Change the Transparency of the Pie Chart
For that, open the Image Options window by right-clicking on the pie chart or selecting Format > Image > Image options.
You can adjust the transparency under the Transparency option in Adjustments. You can also customize the brightness and contrast of your pie chart.

Also Read: How to insert images in Google Docs
Was this helpful?
Last updated on 16 July, 2024
Read Next
 How to Add and Customize a Trendline on a Chart in Google Sheets
How to Add a Trendlline in Google Sheets The purpose of a trendline is to highlight the patterns in data.
How to Add and Customize a Trendline on a Chart in Google Sheets
How to Add a Trendlline in Google Sheets The purpose of a trendline is to highlight the patterns in data.
 How to Make and Customize Text Columns in Google Docs
How to Turn Text Into Columns in Google Docs By default, Google Docs's page setup is Pages.
How to Make and Customize Text Columns in Google Docs
How to Turn Text Into Columns in Google Docs By default, Google Docs's page setup is Pages.
 How to Add, Customize and Delete a Text Box in Microsoft Word
Like in Microsoft PowerPoint, you can add a text box to a Microsoft Word document.
How to Add, Customize and Delete a Text Box in Microsoft Word
Like in Microsoft PowerPoint, you can add a text box to a Microsoft Word document.
 How to Add or Remove Strikethrough Text in Google Docs
Method 1: Add or Remove Strikethrough on Desktop Step 1: Launch Google Docs and highlight the text that needs the strikethrough.
How to Add or Remove Strikethrough Text in Google Docs
Method 1: Add or Remove Strikethrough on Desktop Step 1: Launch Google Docs and highlight the text that needs the strikethrough.
 4 Ways to Add Captions to Images in Google Docs
Method 1: Use the Drawing Panel Using the Drawing panel is probably the most effective way of captioning images in Google Docs.
4 Ways to Add Captions to Images in Google Docs
Method 1: Use the Drawing Panel Using the Drawing panel is probably the most effective way of captioning images in Google Docs.
 How to Add Custom Bullet Points in Google Docs
Add Custom Bullet Points in Google Docs on Desktop Using Google Docs in a web browser on a desktop is convenient for working on a document.
How to Add Custom Bullet Points in Google Docs
Add Custom Bullet Points in Google Docs on Desktop Using Google Docs in a web browser on a desktop is convenient for working on a document.
 2 Easy Ways to Add Fonts to Google Docs
In any document, selecting the right font is an important task.
2 Easy Ways to Add Fonts to Google Docs
In any document, selecting the right font is an important task.
 How to Add and Remove Line Numbers in Google Docs
How to Add Line Numbers in Google Docs You can add line numbers to the entire document or select sections in Google Docs.
How to Add and Remove Line Numbers in Google Docs
How to Add Line Numbers in Google Docs You can add line numbers to the entire document or select sections in Google Docs.
The article above may contain affiliate links which help support Guiding Tech. The content remains unbiased and authentic and will never affect our editorial integrity.