
Hitting “F5” and only getting an “Unable to start debugging” error can be incredibly tedious to troubleshoot. Luckily, this usually isn’t caused by a bug in the code but rather due to a configuration or environment problem. Here are the main reasons why Visual Studio can’t start debugging and possible fixes you should try before delving into the program’s support section.
Fix 1 – Set the Correct Startup Project if Visual Studio Can’t Start Debugging
If your current program has multiple projects, Visual Studio needs one explicitly marked as the startup project to start debugging it. The startup project runs first, which can allow it to properly load necessary libraries or data you need for the others.
Step 1. Go to the Solution Explorer tab and right-click on the main project.
Step 2. Select “Set as Startup Project” from the list.
Step 3. Right-click on the same project again and open “Properties.”
Step 4. In the “Debug” tab (or the “Web” tab for web projects),confirm that “Enable Debugging” is checked. For C++ projects, check under “Debugging” then “Launch.” For Python or Node.js, look for their debugging options.
Fix 2 – Retry IIS Express (ASP.NET or PHP Projects)
Some ASP.NET and PHP projects rely on IIS Express (which is a Windows utility rather than Visual Studio’s) during debugging. If it’s missing or outdated, the project might not get built properly.
Step 1. Go to the Windows search bar, type in “Programs,” then open the first option. This should be “Programs and Features” (but you might also get the Control Panel, in which case you can find it there).
Step 2. Find “IIS Express” in the list and select it.
Step 3. Use the “Change” or “Repair” option and let the process finish, then restart the PC and check the debugger.
Step 4. If you still can’t debug the project, go to “Tools” then “Options” in Visual Studio. In the “Web Projects” section, check the option “Use the 64-bit version of IIS Express.”
Fix 3 – Force Remake the Launch Settings File
The variables needed for Visual Studio to run are stored in a file called “launchSettings.json.” If an entry in it is wrong or corrupted, the debugger fails to start.
Step 1. Close Visual Studio completely.
Step 2. Open File Explorer and go to your project folder.
Step 3. Search the Properties folder for “launchSettings.json” (Some projects may put the file under “.vs” instead).
Step 4. Delete the file.
Step 5. Reopen Visual Studio and load your project.
Step 6. Go to “Build” and select “Rebuild Solution,” then hit “F5.”
Fix 4 – Change Antivirus Settings
Antivirus software, including the stock Windows Defender, can interfere with Visual Studio by blocking internet access to temporary files the debugger creates.
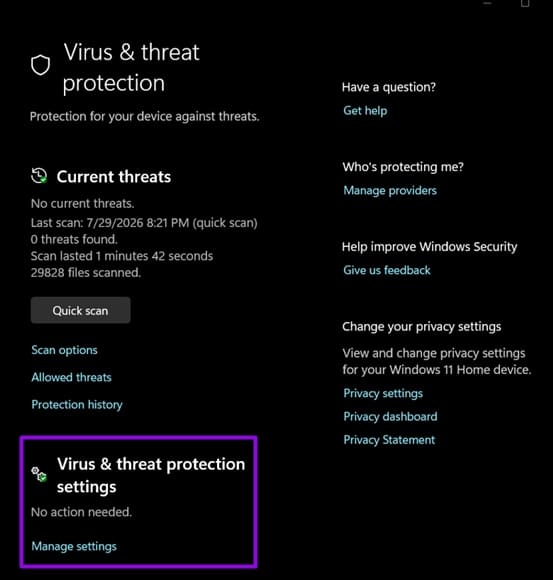
Step 1. Go to “Windows Security,” then to “Virus & threat protection.”
Step 2. Open “Manage settings.”
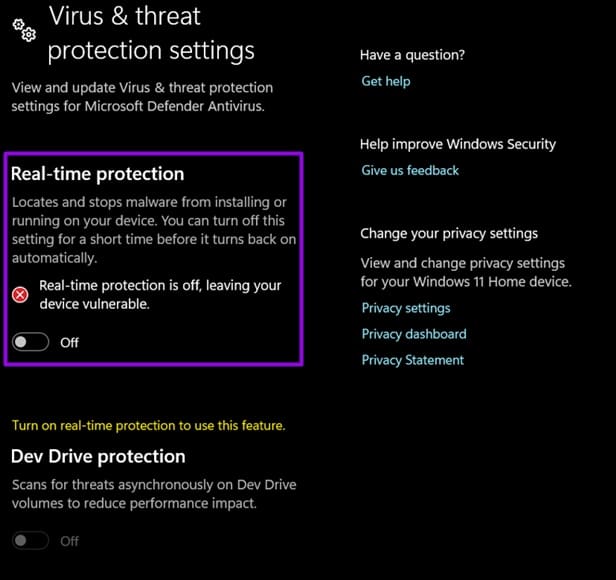
Step 3. Switch off “Real-time protection.” You’ll need to confirm the User Account Control Prompt.
Step 4. Go back to Visual Studio and try debugging again.
If you’re using third-party software, go to its control panel and disable real-time filtering and online access. Make sure to not use your browser in that time.
If this works, turn real-time protection back on and instead add exclusions for the Visual Studio installation folder and your project directories.
Was this helpful?
Last updated on 25 August, 2026
Read Next
 How to Record High-Quality Gameplay Videos Using OBS Studio
How to Setup OBS Studio to Recording Game Play Before recording your gameplay, you must set up OBS Studio.
How to Record High-Quality Gameplay Videos Using OBS Studio
How to Setup OBS Studio to Recording Game Play Before recording your gameplay, you must set up OBS Studio.
 How to Integrate Google Drive With Grok Studio
For teams that use Google Drive regularly, integrating it with Grok Studio can offer more advanced organization and data analytics once Grok AI is given access to the files.
How to Integrate Google Drive With Grok Studio
For teams that use Google Drive regularly, integrating it with Grok Studio can offer more advanced organization and data analytics once Grok AI is given access to the files.
 Start Menu on Windows 10 Won’t Open: Here Are 11 Ways to Fix It
Windows Start Menu is a gateway to all the apps and software available on your system.
Start Menu on Windows 10 Won’t Open: Here Are 11 Ways to Fix It
Windows Start Menu is a gateway to all the apps and software available on your system.
 3 Eays to Fix Windows 10 Full Screen Start Menu When It’s Stuck
Fix 1: Turn off the Full-Screen Setting Microsoft offers a native setting that allows users to switch from the normal Start Menu to the expanded one.
3 Eays to Fix Windows 10 Full Screen Start Menu When It’s Stuck
Fix 1: Turn off the Full-Screen Setting Microsoft offers a native setting that allows users to switch from the normal Start Menu to the expanded one.
 6 Ways to Fix Icons Missing From Start Menu on Windows 11
Fix 1: Restart Windows Explorer Windows Explorer process is responsible for providing the graphical interface for several utilities, including the Start menu.
6 Ways to Fix Icons Missing From Start Menu on Windows 11
Fix 1: Restart Windows Explorer Windows Explorer process is responsible for providing the graphical interface for several utilities, including the Start menu.
 Top 10 Ways to Fix ‘Display Driver Failed to Start’ Error in Windows 10 and 11
Display drivers facilitate communication between the Windows operating system (or any OS) with your GPU.
Top 10 Ways to Fix ‘Display Driver Failed to Start’ Error in Windows 10 and 11
Display drivers facilitate communication between the Windows operating system (or any OS) with your GPU.
 Fix Your PC Did Not Start Correctly (Windows 11) Message
Move over, Blue Screen of Death, you’ve got a strong competitor for the worst thing to see on your monitor screen.
Fix Your PC Did Not Start Correctly (Windows 11) Message
Move over, Blue Screen of Death, you’ve got a strong competitor for the worst thing to see on your monitor screen.
 How to Disable Web Search in Windows 11 Start Menu
Use Registry Editor To disable web search in the Windows 11 Start Menu, follow these steps: Step 1: Open the Registry Editor and navigate to the following key: Computer\HKEY_CURRENT_USER\Software\Policies\Microsoft\Windows Step
How to Disable Web Search in Windows 11 Start Menu
Use Registry Editor To disable web search in the Windows 11 Start Menu, follow these steps: Step 1: Open the Registry Editor and navigate to the following key: Computer\HKEY_CURRENT_USER\Software\Policies\Microsoft\Windows Step
The article above may contain affiliate links which help support Guiding Tech. The content remains unbiased and authentic and will never affect our editorial integrity.