Types of Dump Files on Windows
- Complete Memory Dump: This memory dump records all the contents of system memory when your system hits a BSOD error. This dump contains data from the processes running when the memory dump was collected.
- Kernel Memory Dump: This dump file only stores data from kernel memory, meaning it doesn’t contain data from unused or unallocated memory or any memory allocated to user-mode programs.
- Small Memory Dump: This dump file stores information that could help figure out what went wrong to cause the BSOD error. This file holds the Stop message and its parameters, a list of loaded drivers, and other details.
- Automatic Memory Dump: This dump file contains the same information as a Kernel Memory Dump. The difference between the two is not in the dump file itself but in how Windows sets the size of the system paging file.
How to Change Memory Dump File Settings Using Windows Settings
Step 1: Press the Windows key, type Settings, and click on Open.
Step 2: In the right pane, scroll down to About and click on it.

Step 3: In the Device specifications, under the Related link, select Advanced system settings.
Note: If you are on Windows 10, you will find Related settings instead of Related link, under which, select Advanced system settings.

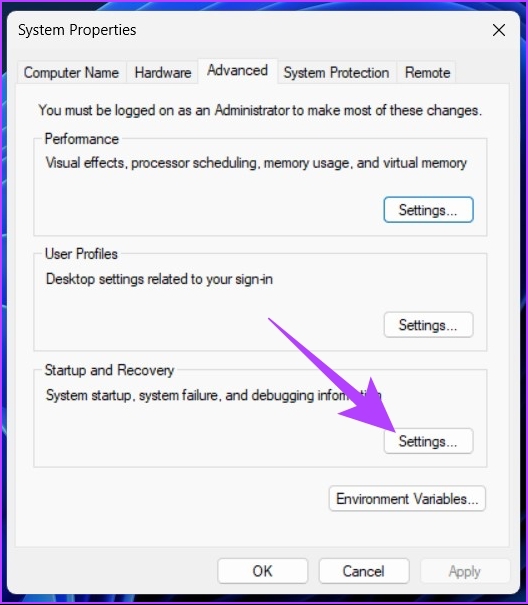
The System Properties window will appear.
Step 4: Select Settings under Startup and Recovery.
Step 5: Now, under the System failure option, click on the drop-down menu of Write debugging information > select Automatic memory dump. Finally, click on OK.
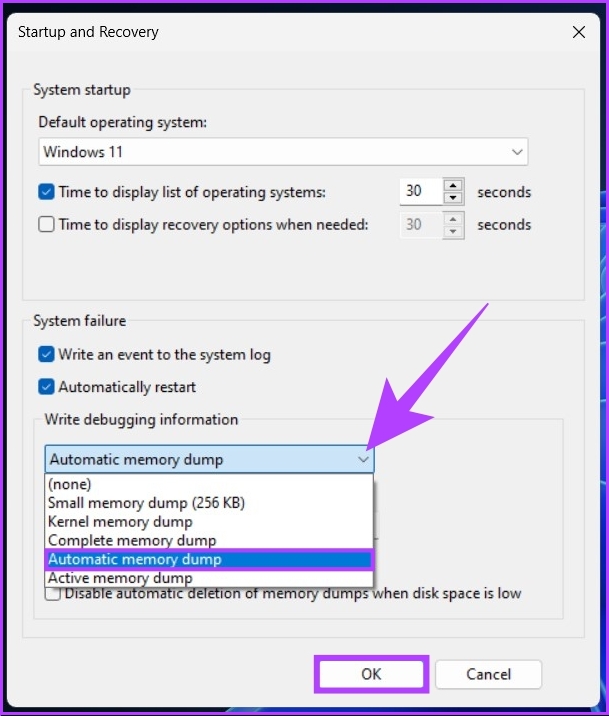
This setting changes the details collected from memory dump files when a BSOD occurs. So, that you can view and understand the cause of the error. You may need to restart your PC to implement the changes effectively.
How to Analyze Windows Memory Dump Files
1. Using WinDbg Preview
Step 1: Press the Windows key, type Microsoft Store, and press Enter.
Step 2: In the search bar, type WinDbg Preview, and press Enter.

Step 3: Click on Get to install WinDbg Preview.

Step 4: Once installed, press the Windows key, type WinDbg Preview, and click on Run as administrator.
Step 5: In the WinDbg Preview Window, go to File from the top menu.
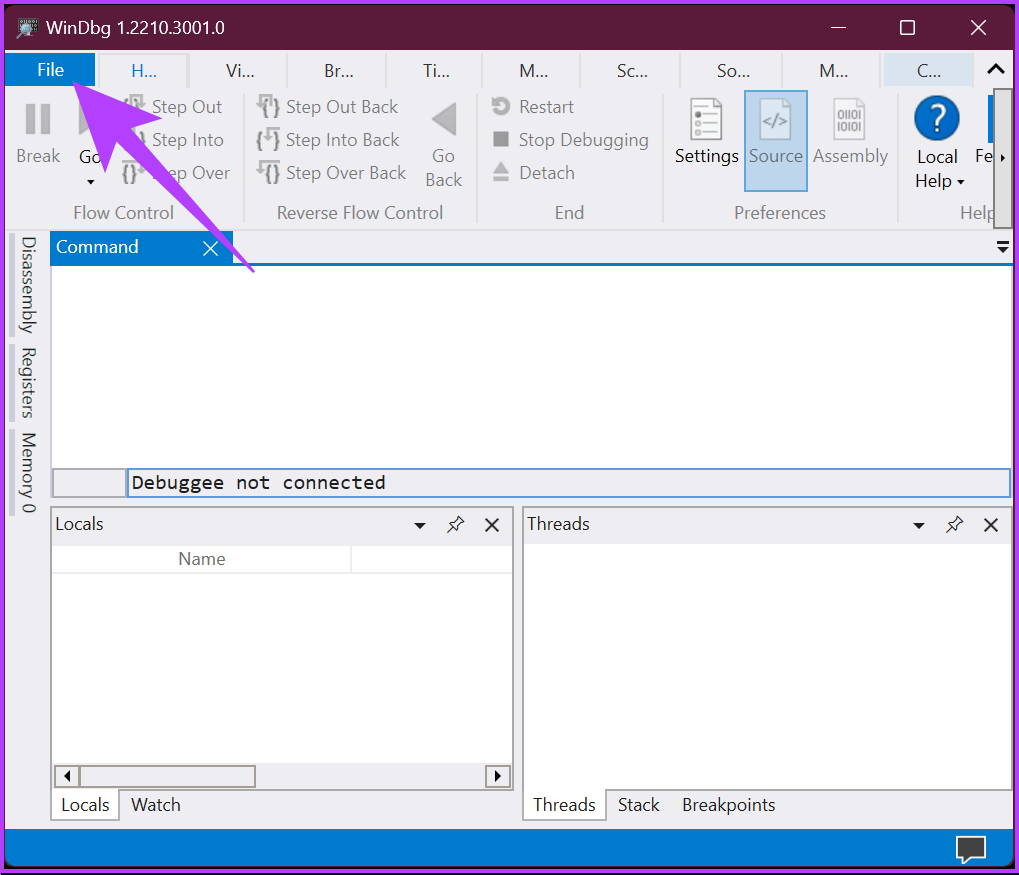
Step 6: Select Start debugging > Open dump file in the right pane.
Step 7: Browse and locate the dump file > click on Open.
Note: You can find the latest dump file in the root C:\ folder, C:\minidump, or C:\Windows\minidump folder.

Once you open the dump file, WinDbg loads it and runs. Depending on the file size, It may take time to process.
Step 8: Now, type the below command in the command tab and press Enter.
! analyze -v

This command will start analyzing the dump file. This can take a few minutes to complete. Once it is complete, you should see the results in the top Window. With the result, you can troubleshoot the error that caused the crash.
2. Using BlueScreenView
This program scans and analyzes BSOD errors. It automatically picks up the Minidump directory dump file and processes it. Here’s how to install and run it.
Step 1: Download BlueScreenView > install and run it.
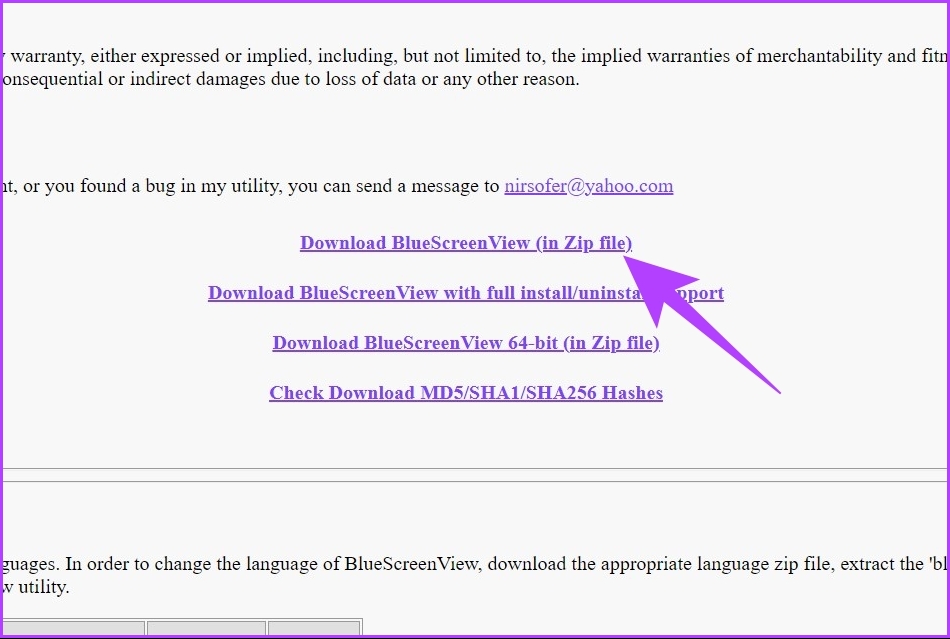
BlueScreenView auto-fetches the dump files from your system. If it didn’t, go to Options > click on Advanced Options > under the Load from the following MiniDump folder box, click on Browse > OK.
Step 2: Click on the dump files listed in the application.
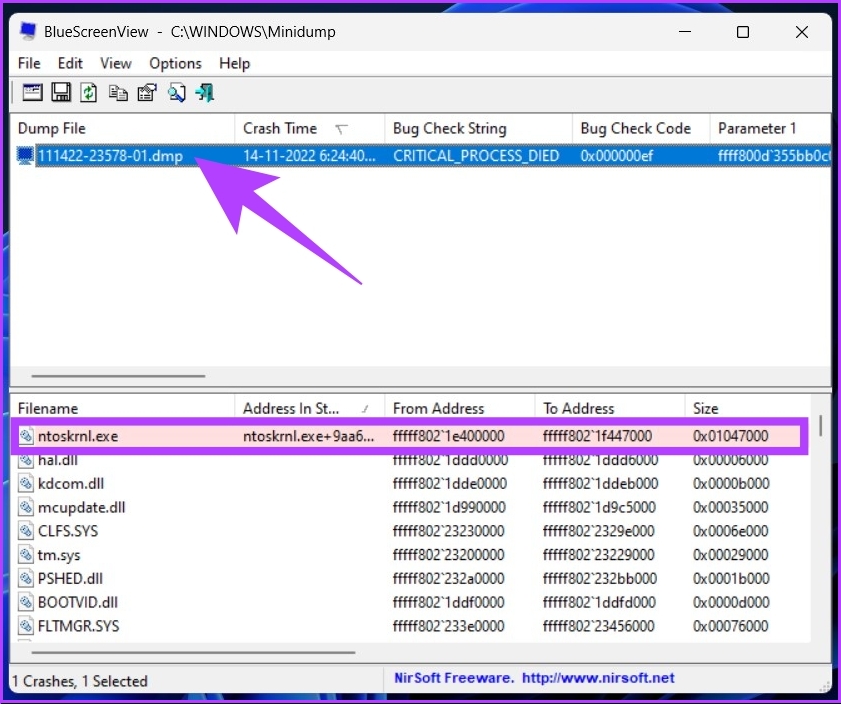
The memory dump file selected will have a list of active files and drivers. The file highlighted in red will have a direct link to the cause of the BSOD error. You can click on it to troubleshoot the issue.
BlueScreenView is only useful to find the error causing the BSOD, unlike WinDbg, which also lets you debug the issue.
FAQs
Yes, you can. The quickest and safest way to delete dump files is to open Disk Cleanup, using the Windows Search tool > select Clean up system files > under files to delete, select System error memory dump files > click on OK.
It is simple to locate dump files on Windows 11. Open the Windows File explorer > go to C:\Windows\Minidump.
Was this helpful?
Last updated on 20 August, 2024
Read Next
 How to Use Spreadsheet Compare to Analyze Excel File Differences
How to Analyze Two Versions of a Workbook With Microsoft Spreadsheet Compare You must import both workbooks into the Spreadsheet Compare tool to analyze different workbook versions.
How to Use Spreadsheet Compare to Analyze Excel File Differences
How to Analyze Two Versions of a Workbook With Microsoft Spreadsheet Compare You must import both workbooks into the Spreadsheet Compare tool to analyze different workbook versions.
 5 Best Ways to Fix Can’t Open Files in OneDrive Error in Windows
People use OneDrive for storing and saving files in all formats.
5 Best Ways to Fix Can’t Open Files in OneDrive Error in Windows
People use OneDrive for storing and saving files in all formats.
 How to Fix and Open Corrupt Folder and Files in Windows 10
I can imagine your astonishment when you click on a folder or a file and it doesn't open on your Windows 10 PC.
How to Fix and Open Corrupt Folder and Files in Windows 10
I can imagine your astonishment when you click on a folder or a file and it doesn't open on your Windows 10 PC.
 6 Ways to Fix Microsoft Teams Can Not Open Files on Windows
Fix 1.
6 Ways to Fix Microsoft Teams Can Not Open Files on Windows
Fix 1.
 How to Create and Open Batch (BAT) Files on Windows 11
How to Create a Batch File (.Bat) on Windows 11 It's easy to make a BAT file on Windows 11.
How to Create and Open Batch (BAT) Files on Windows 11
How to Create a Batch File (.Bat) on Windows 11 It's easy to make a BAT file on Windows 11.
 How to Open Files and Folders in CMD on Windows
How to Open a File Using Command Prompt on Windows Here's how you can easily open Command Prompt on your PC and use it to access a file.
How to Open Files and Folders in CMD on Windows
How to Open a File Using Command Prompt on Windows Here's how you can easily open Command Prompt on your PC and use it to access a file.
 Samsung My Files vs Google Files: Which File Manager Is Better on Galaxy Phones
Samsung apps are bundled to replace the official Google Apps in the One UI.
Samsung My Files vs Google Files: Which File Manager Is Better on Galaxy Phones
Samsung apps are bundled to replace the official Google Apps in the One UI.
 How to Open JSON Files on Windows and Mac
How to Open JSON Files on Mac Here are two ways to open JSON files on your Mac.
How to Open JSON Files on Windows and Mac
How to Open JSON Files on Mac Here are two ways to open JSON files on your Mac.
The article above may contain affiliate links which help support Guiding Tech. The content remains unbiased and authentic and will never affect our editorial integrity.